What is the significance of the "Plot Progression Visualizations/ Dynamic Act Schematics"?

Many of the story analyses on the site have diagrams at the bottom labeled “Plot Progression Visualizations/ Dynamic Act Schematics”. They seem to visually describe the story’s OS, MC, IC and RS throughlines within the 4 act structure. But beyond that I don’t understand the significance of their shading/gradation patterns and the meaning of the various separations. Or what value this visualization is. Why are some acknowledging each signpost? Why are some shading through a signpost without a clear division. Can someone explain?

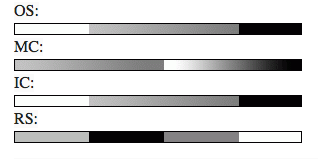
In the example shown above, why are OS and IC identical in form? What is the significance of that? What is the significance of the darker areas being near the end on the OS, MC and IC? Yet why is OS and IC fully shaded on the fourth act vs. the MC merely gradates to black near the end? Why is there clear separation on MC between SP 2 & 3 whereas on OS and IC the separation is between SP 1 & 2 and 3 & 4? Yet with the RS, the clear separations are at every signpost. Why? I realize the particular storyform this was generated from created these patterns, but generally what do all these subtleties, and relationships between them and the structure, mean? What in the story form is causing the visualization characteristics? How could this type of visualization help a writer, analyzer distinguish a storyform?

I’m not sure how much of this you know, so forgive me if I overexplain a bit.

Basically, you have four Signposts and three Journeys. Each Journey can either be a Slide (where the Journey moves across a Dynamic Pair, like Doing->Obtaining) or a Bump (where the Journey moves across something other than a Dynamic Pair, like Doing->Gathering Information). Two Signposts joined together by a Slide will feel like they naturally flow together, while two Signposts joined by a Bump will feel more abrupt. Thus, the colors. Whenever the two colors blend together, you have a Slide. When the two colors don’t blend together, you get a Bump. White is the top-left corner (e.g. Understanding), light gray is the top-right corner (e.g. Doing), dark gray is the bottom-left corner (e.g. Obtaining), and black is the bottom-right corner (e.g. Gathering Information).

This also gives you three different possibilities: the U (Bump-Bump-Bump), the Z (Bump-Slide-Bump), and the hairpin (Slide-Bump-Slide). The U will feel like 4 Acts, since all of them are broken apart; the Z will feel like three Acts, the common example of “Act 1, long Act 2, Act 3;” and a Hairpin will feel like 2 Acts with an abrupt shift at the midway point. In your example, the OS and IC are Zs, the MC is a hairpin, and the RS is a U. As to how the program decides which structure to use when, I’m afraid that’s beyond my knowledge. (It’s the only thing I haven’t cracked.) As far as I know, there doesn’t have to be a connection between any of the Acts. There usually is, but not always. Hope that helps!

3 Likes

Thank you, actingpower. Your description helps me understand the bump/slide dynamic. I guess I missed that chapter in my review of the theory book and other materials. Is there a more in depth explanation of this available there? Or anywhere?

I see these visualizations in the posted analyses on this site. But how does one obtain a visualization like this for a storyform creation of one’s own? I’ve rummaged through the various reports and don’t see one that generates this kind of visualization. Can anyone point out if it is available in the DSE software? Or is this, in large measure, simply choices that the author made and not related specifically to the software functions?

Also… this brings up another related question. Are analyzed works described in storyform as it appears in the “work” (i.e. in the sequence of events presented in the final version of the story that we all experience?) or in the chronological sequence of the storyform events (plot sequence). For example is a movie like “Pulp Fiction” or “Remains of the Day” analyzed in its chronological plot order or in the sequence of events in which the story was presented (unchronological)? I presume the answer in regards to these plot progression visuals would be chronological plot sequence. But is that correct?

These are kind of amazing visuals for analysis. For instance, the one shown above was from “The Devil Wears Prada” analysis on this site. And just looking at it, while running through each throughline in my head (and now knowing the bump-slide dynamic), one can really feel the throughlines behave that way.

In the OS, the big shift happens between act 1 and act 2 when Andy gets the job when IC Miranda gives her the job. The IC big shift happens at the same time when she decides to go with “the smart, fat one”. In the MC story, the big shift happens between act 2 and 3 when Andy decides to give it her all and get made over by Nigel. And in the RS story it feels that there are 4 different slight shifts along they way between MC and IC that propel the other storylines. Again, its amazing how these visualizations capture the feel of the storylines. Whereas before I didn’t understand them, I’m now in love with them.

2 Likes

Haha, well, it’s good to hear that you love them! :smiley: I generally get the idea of them, but I haven’t really done too much work with them yet. If you go to this page in the theory book and Ctrl+F “Identifying Some Familiar Patterns,” you’ll see the original explanation of the color bars. (Also Ctrl+F “Act Patterns” for the stuff about bumps and slides.) But you’re right in that it does visualize where the most important changes are. So in Hamlet, the Overall Story’s biggest twist is in the middle, when Hamlet “accidentally” kills Polonius. As Main Character, Hamlet’s big twists are at the end of the first act, where he learns of his father’s murder, and at the end of the third act, when he really accepts that he must take action. The Ghost as Impact Character causes the biggest twist when Hamlet’s pursuit of the truth tips off Claudius to Hamlet’s aims. The Relationship, then, hits all three of these points, each as a twist. (The revelation of murder, “The Mousetrap”, and the death of Polonius.)

If you want to do it for your own story, all you have to do is do the Plot Progression for your story. It won’t make the boxes for you, but you can make them on your own. For example, a story I was working on is Change/Stop/Do-er/Logical/Action/Optionlock/Success/Bad/Activity/Obtaining/Self-Interest/Uncontrolled. The Overall Throughline progression is Gathering Information->Doing->Obtaining->Understanding. My box would be black first, then light gray (a bump), then dark gray (a slide), then white (a bump). Thus, that Throughline is a Z. The Relationship Throughline goes black, white, light gray, dark gray (a hairpin), the Main Character Throughline is the same, and the Impact Character Throughline is dark gray, black, light gray, white (hence, a U).

When a story is “unreliable” like that, then you need to understand it in the order it actually happened. The Overall Story should be understood in the objective order it happened, while the Main Character Story should be understood in the order the Main Character experiences it and grows. Like in Memento, the movie should be understood as the first scene of the movie being last, and the last one being first. Imagine a story where we have a character like Merlin who experiences time backward. Merlin’s character development would occur backward, but the overall story would go forward.

I had made a note to follow up on this post while researching and drafting my latest article, but I see that @actingpower had it all covered!

Yes you have to manually make these vizualizations yourself; there isn’t a report that displays them. That said, you really don’t need them, as long as you know where your bumps and slides are.

The way the current Table of Story Elements are arranged, the item across from the one in question is the most similar while those horizontal and vertical are more tangential.

My latest article Writing Screenplays with Dramatica and Fountain explains how I use them to write. You might find it helpful.